
Select a specific process
Define the workstation, operation or product flow whose result needs to improve. Agree which events and indicators will be recorded.
Instant consultation, immediate impact. Why wait?
 Let's dive right into how Iwoscan can reshape your manufacturing pipeline
Our experts are here to guide you through the transformation
No strings attached
Welcome to the Iwoscan!
At Iwoscan, we are more than just a company; we are the pioneers of precision and efficiency, the architects of innovation, and the champions of progress.
Sign in and embark on the journey together!
If you still need to register, we encourage you to create an account and elevate your experience. You'll gain:
- Exclusive access to analytics
- The ability to personalize your experience
- Receive notifications and stay updated
Iwoscan records tasks, operation times, cycles, downtime, scrap, and employee and equipment working time at each workstation. Managers can see process status in real time and compare workstations, shifts, products and periods. Production optimisation is based on actual process data rather than reports reconstructed at the end of a shift.
Odoo ERP friendly Built-in task splitting and merging Raw data without distortion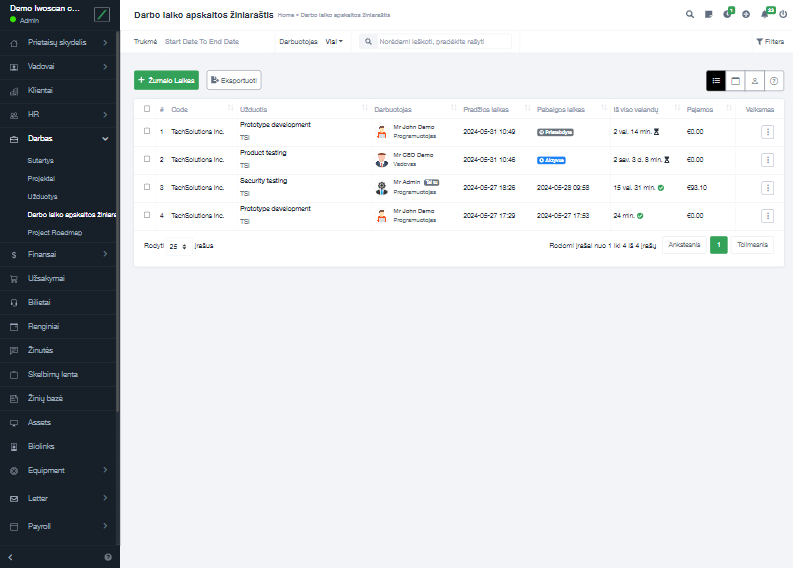
Only what is measured consistently and accurately enough can be optimised. Iwoscan connects workstation status, task, product, employee and event duration into one coherent data stream.
Iwoscan does not decide how production should be changed. It helps establish the current state accurately, select the largest loss and verify the result of the change made.
Define the workstation, operation or product flow whose result needs to improve. Agree which events and indicators will be recorded.
Record tasks, cycles, working and setup time, downtime, scrap and completed quantity. This baseline becomes the point of comparison.
Compare data by workstation, shift, product, task and period. This identifies which cause has the greatest impact on flow, time or quality.
Change an instruction, tool, material supply, task allocation, maintenance procedure or another specific process element.
After the change, assess the same indicators under comparable production conditions. This shows whether cycle time, downtime or scrap decreased and whether other process results deteriorated.
A single consistent data source lets the team discuss process results using the same figures and distinguish a genuine problem from an isolated impression.

Operation, cycle, setup and downtime durations are recorded while the work is being performed.

When a task includes a planned quantity and time, OEE can be calculated; without them, equipment availability and actual states are assessed.

Downtime, scrap, waiting and other events have a specific time, location and production context.

Historical data shows whether a change improved the selected indicator without creating a new loss elsewhere.

Data loggers store information at the workstation first, so recording continues during temporary network interruptions.

Iwoscan can work with its own data loggers, existing terminals or tablets and transfer data to ERP, MRP or another system.
Briefly describe the process, equipment and data that is currently missing.
We will explain what can be recorded, which Iwoscan set is suitable and how the data can reach your systems.
No. The system collects and links actual process data, shows the structure of losses and enables before-and-after comparisons. The production team decides what should be changed.
You can record the employee, task, task status and duration, completed quantity, cycles, downtime and its reasons, scrap, equipment working time and other events required for the specific process.
Workstation loads, task and waiting times, cycles and product movement are compared. If a production structure or plan is provided, the stage restricting overall flow can be identified.
Not necessarily. Iwoscan can collect data at workstations and transfer it to the ERP, MRP or another system already in use. The scope of integration depends on the existing software and its data interfaces.
Start with one workstation or process, define the problem and select the indicators used to assess the result. Then choose the data-recording method, reports and required integration.