

Select a specific process and period
Start with one workstation, machine, or production line. Define the shift, Planned Production Time, and any periods that are excluded from the OEE calculation.
Instant consultation, immediate impact. Why wait?
 Let's dive right into how Iwoscan can reshape your manufacturing pipeline
Our experts are here to guide you through the transformation
No strings attached
Welcome to the Iwoscan!
At Iwoscan, we are more than just a company; we are the pioneers of precision and efficiency, the architects of innovation, and the champions of progress.
Sign in and embark on the journey together!
If you still need to register, we encourage you to create an account and elevate your experience. You'll gain:
- Exclusive access to analytics
- The ability to personalize your experience
- Receive notifications and stay updated
OEE combines three aspects of the production process: Availability, Performance, and Quality. Iwoscan helps record run time, stops, cycles, production quantities, and quality events at the workstation. This allows the overall score to be broken down into specific causes that the team can investigate and reduce.
Odoo ERP friendly Built-in task splitting and merging Raw data without distortion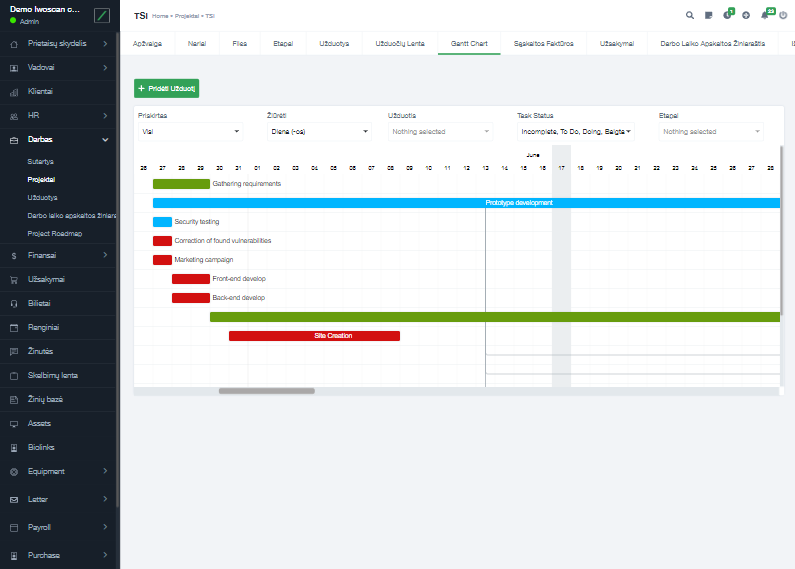
OEE stands for Overall Equipment Effectiveness. It is calculated by multiplying Availability, Performance, and Quality. Each factor represents a different group of production losses.
Reliable OEE starts with clear calculation boundaries and actual production data. The improvement cycle should show not only what changed, but why.
Start with one workstation, machine, or production line. Define the shift, Planned Production Time, and any periods that are excluded from the OEE calculation.
The Ideal Cycle Time should reflect the fastest sustainable rate of the process, not a conveniently reduced planning speed. An inaccurate value can artificially improve or reduce the Performance score.
Iwoscan records Run Time, Stop Time, cycles, Total Count, and Good Count. At the workstation, the operator can select a stop, scrap, or another agreed reason, and the event is stored with its production context.
Calculate Availability, Performance, and Quality. The team reviews not only the overall percentage but also the duration, frequency, reasons, and distribution of losses by product, shift, or workstation.
After addressing the selected cause, compare periods calculated in the same way. This shows whether the specific loss decreased and whether the improvement came at the expense of another OEE factor.
The data collection method is adapted to the actual process. Machine signals, recorder inputs, RFID or barcode and QR code scans, and employee selections can be combined into a single history of production events.

A machine signal or workstation action records when production is running and when the process stops.

The operator selects a reason configured for the process, so every stop has both a duration and an explanation.

Cycle signals, scanning, or operator input can record Total Count and the actual production rate.

Good parts, scrap, and units requiring rework are linked to the task, product, time, and workstation.

The recorder stores data locally first, so the production history is not lost during temporary network interruptions.

Process data can be transferred to an ERP, MRP, or another management system and used for reporting and further analysis.
Briefly describe the process, equipment and data that is currently missing.
We will explain what can be recorded, which Iwoscan set is suitable and how the data can reach your systems.
OEE is calculated by multiplying Availability, Performance, and Quality. Availability is the ratio of Run Time to Planned Production Time. Performance compares Ideal Cycle Time and Total Count with actual Run Time. Quality is the ratio of Good Count to Total Count.
You need Planned Production Time, actual Run Time and Stop Time, Ideal Cycle Time, Total Count, and Good Count. To use OEE for improvement, it is also important to record the reasons behind availability, speed, and quality losses.
No. OEE measures losses in a selected machine or production process during Planned Production Time. Employees help provide context for events, but the metric should not be used as a simplified score of individual performance.
There is no single universal target for every factory. The result depends on the type of process, product mix, batch sizes, and calculation boundaries. It is more useful to establish a reliable baseline for your own process and steadily reduce its largest losses.
Select one important workstation or machine, agree on the rules for Planned Production Time and Ideal Cycle Time, and define several key downtime reasons. The first stage should show whether the data is reliable and whether the team can use it to complete a specific improvement action.